Self-Hosted Monitoring for Spring Boot Applications
Last updated: January 8, 2024


Mocking is an essential part of unit testing, and the Mockito library makes it easy to write clean and intuitive unit tests for your Java code.
Get started with mocking and improve your application tests using our Mockito guide:
Handling concurrency in an application can be a tricky process with many potential pitfalls. A solid grasp of the fundamentals will go a long way to help minimize these issues.
Get started with understanding multi-threaded applications with our Java Concurrency guide:
Spring 5 added support for reactive programming with the Spring WebFlux module, which has been improved upon ever since. Get started with the Reactor project basics and reactive programming in Spring Boot:
Since its introduction in Java 8, the Stream API has become a staple of Java development. The basic operations like iterating, filtering, mapping sequences of elements are deceptively simple to use.
But these can also be overused and fall into some common pitfalls.
To get a better understanding on how Streams work and how to combine them with other language features, check out our guide to Java Streams:
Explore Spring Boot 3 and Spring 6 in-depth through building a full REST API with the framework:
Yes, Spring Security can be complex, from the more advanced functionality within the Core to the deep OAuth support in the framework.
I built the security material as two full courses - Core and OAuth, to get practical with these more complex scenarios. We explore when and how to use each feature and code through it on the backing project.
You can explore the course here:
Spring Data JPA is a great way to handle the complexity of JPA with the powerful simplicity of Spring Boot.
Get started with Spring Data JPA through the guided reference course:
Refactor Java code safely — and automatically — with OpenRewrite.
Refactoring big codebases by hand is slow, risky, and easy to put off. That’s where OpenRewrite comes in. The open-source framework for large-scale, automated code transformations helps teams modernize safely and consistently.
Each month, the creators and maintainers of OpenRewrite at Moderne run live, hands-on training sessions — one for newcomers and one for experienced users. You’ll see how recipes work, how to apply them across projects, and how to modernize code with confidence.
Join the next session, bring your questions, and learn how to automate the kind of work that usually eats your sprint time.
Distributed systems often come with complex challenges such as service-to-service communication, state management, asynchronous messaging, security, and more.
Dapr (Distributed Application Runtime) provides a set of APIs and building blocks to address these challenges, abstracting away infrastructure so we can focus on business logic.
In this tutorial, we'll focus on Dapr's pub/sub API for message brokering. Using its Spring Boot integration, we'll simplify the creation of a loosely coupled, portable, and easily testable pub/sub messaging system:
1. Introduction
One of the many great features of Spring Boot is the set of built-in actuators. These actuators provide an easy way to monitor and control just about every aspect of a Spring Boot application.
In this tutorial, we’ll look at using the metrics actuator to create a self-hosted monitoring solution for Spring Boot applications.
2. Metrics Database
The first part of monitoring Spring Boot applications is choosing a metrics database. By default, Spring Boot will configure a Micrometer metrics registry in every application.
This default implementation collects a pre-defined set of application metrics such as memory and CPU usage, HTTP requests, and a few others. But these metrics are stored in memory only, meaning they will be lost any time the application is restarted.
To create a self-hosted monitoring solution, we should first choose a metrics database that lives outside the Spring Boot application. The following sections will discuss just a few of the available self-hosted options.
Note that any time Spring Boot detects another metrics database on the classpath, it automatically disables the in-memory registry.
2.1. InfluxDB
InfluxDB is an open-source time-series database. The quickest way to get started with InfluxDB is to run it locally as a Docker container:
docker run -p 8086:8086 -v /tmp:/var/lib/influxdb influxdbNote that this will store metrics in the local /tmp partition. This is fine for development and testing, but would not be a good choice for production environments.
Once InfluxDB is running, we can configure our Spring Boot application to publish metrics to it by adding the appropriate Micrometer dependency:
<dependency>
    <groupId>io.micrometer</groupId>
    <artifactId>micrometer-registry-influx</artifactId>
</dependency>
Additionally, we need to add a new entry to the application.properties file:
management.metrics.export.influx.uri=http://localhost:8086Out of the box, the database name is set to mydb, whereas the username and password remain unset.
However, we can override the default values using dedicated properties:
management.metrics.export.influx.db=customDbName
management.metrics.export.influx.user-name=myUserName
management.metrics.export.influx.password=mySecret
InfluxDB does not provide a native visualization tool. However, it provides a separate tool called Chronograph that works well for visualizing InfluxDB data.
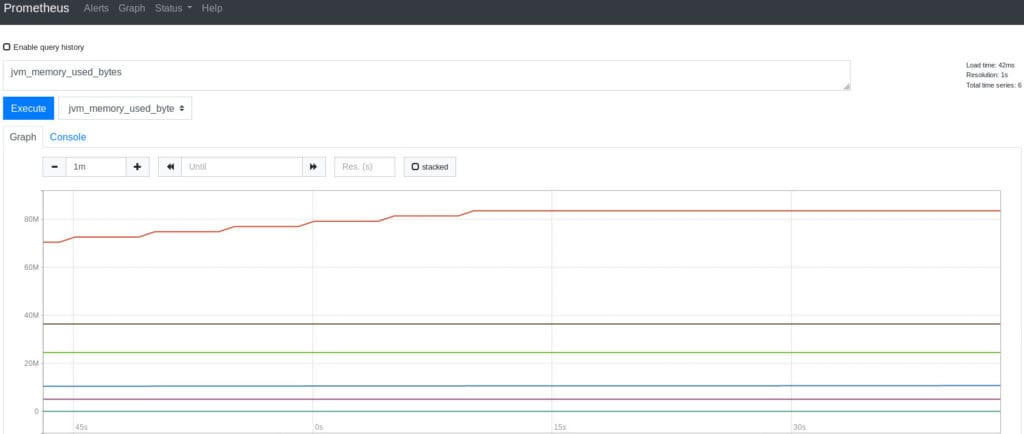
2.2. Prometheus
Prometheus is an open-source monitoring and alerting toolkit originally built at SoundCloud. It works slightly differently from InfluxDB.
Instead of configuring our application to publish metrics to Prometheus, we configure Prometheus to poll our application periodically.
First, we configure our Spring Boot application to expose a new Prometheus actuator endpoint. We do this by including the micrometer-registry-prometheus dependency:
<dependency>
    <groupId>io.micrometer</groupId>
    <artifactId>micrometer-registry-prometheus</artifactId>
</dependency>
This will create a new actuator endpoint that produces metrics data in a special format that Prometheus understands.
Next, we have to configure Prometheus to poll our application by adding our desired configuration into a prometheus.yml file.
The following configuration instructs Prometheus to poll our application every 5 seconds, using the new actuator endpoint:
scrape_configs:
  - job_name: 'spring-actuator'
    metrics_path: '/actuator/prometheus'
    scrape_interval: 5s
    static_configs:
    - targets: ['127.0.0.1:8080']
Finally, we can start a local Prometheus server using Docker. This assumes our custom config file is located in the local file /etc/prometheus/prometheus.yml:
docker run -d \
--name=prometheus \
-p 9090:9090 \
-v /etc/prometheus/prometheus.yml:/etc/prometheus/prometheus.yml \
prom/prometheus \
--config.file=/etc/prometheus/prometheus.yml
Prometheus provides its own visualization tool for viewing metrics that is has collected. It can be accessed at the URL http://localhost:9090/.
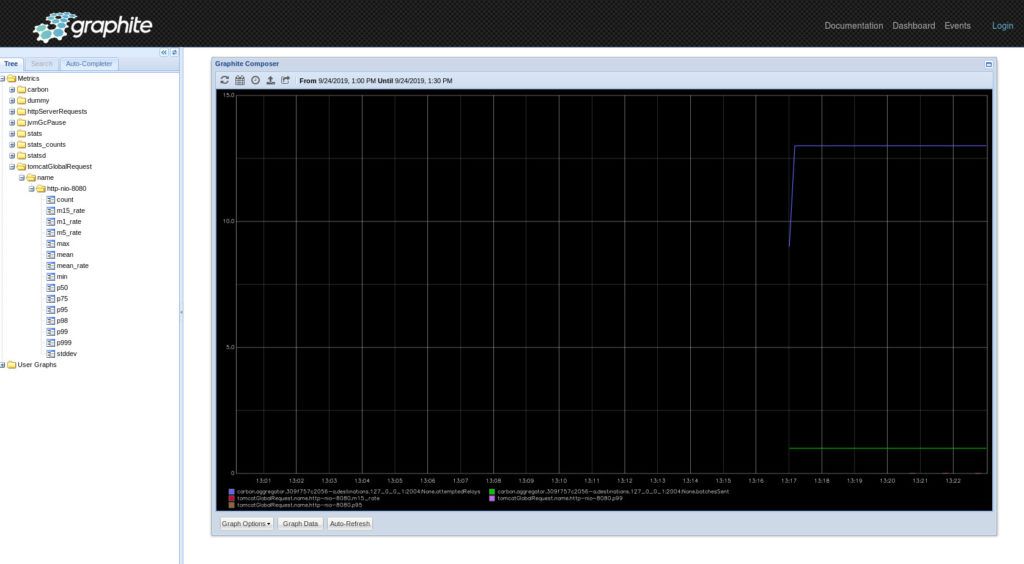
2.3. Graphite
Graphite is another open-source time-series database. Its architecture is slightly more complicated than the other databases we’ve looked at, but with Docker, it’s straightforward to run an instance locally:
docker run -d \
 --name graphite \
 --restart=always \
 -p 80:80 \
 -p 2003-2004:2003-2004 \
 -p 2023-2024:2023-2024 \
 -p 8125:8125/udp \
 -p 8126:8126 \
 graphiteapp/graphite-statsd
Then we can configure Spring Boot to publish metrics to our instance by adding the micrometer-registry-graphite dependency:
<dependency>
    <groupId>io.micrometer</groupId>
    <artifactId>micrometer-registry-graphite</artifactId>
</dependency>
As well as adding the configuration properties to application.properties:
management.metrics.export.graphite.host=127.0.0.1
management.metrics.export.graphite.port=2004
Like Prometheus, Graphite includes its own visualization dashboard. It is available at the URL http://localhost/.
3. Visualization Tools
Once we have a solution for storing metrics outside of our Spring Boot application, the next decision is how we want to visualize the data.
Some of the metrics databases mentioned previously include their own visualization tools. There is a stand-alone visualization tool that is worth looking at for our self-hosted monitoring solution.
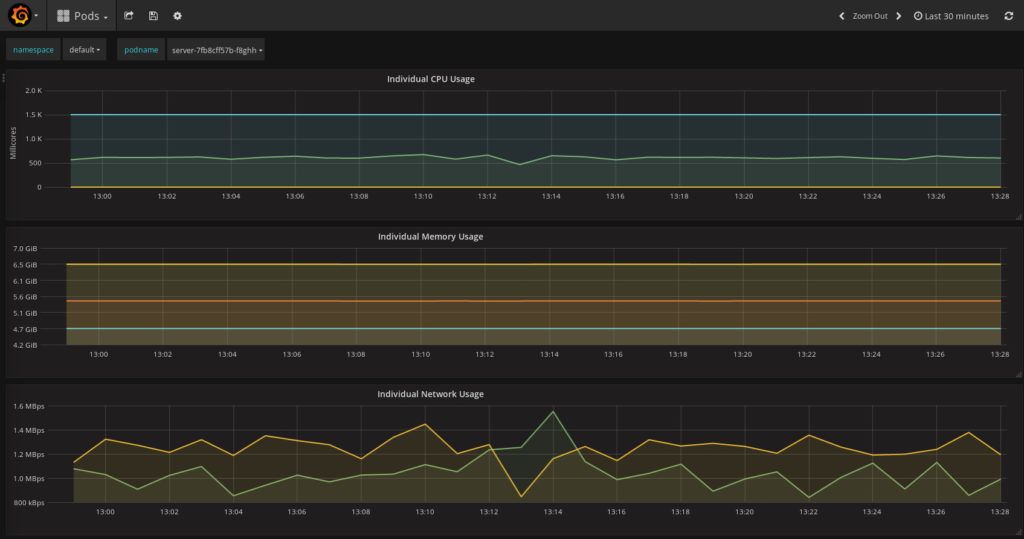
3.1. Grafana
Grafana is an open-source analytics and monitoring tool. It can connect to all of the previously mentioned databases, as well as many others.
Grafana generally provides better configuration and superior alerting than most built-in visualization tools. It can easily be extended using plugins, and there are lots of pre-built dashboards that can be imported to quickly create our own visualizations.
To run Grafana locally, we can start it using Docker:
docker run -d -p 3000:3000 grafana/grafanaWe can now access the Grafana home page at the URL http://localhost:3000/.
At this point, we would need to configure one or more data sources. This can be any of the metrics databases discussed previously or a variety of other supported tools.
Once a data source is configured, we can build a new dashboard or import one that does what we want.
4. Conclusion
In this article, we have looked at creating a self-hosted monitoring solution for Spring Boot applications.
We looked at three metrics databases that Spring Boot readily supports and saw how to run them locally.
We also looked briefly at Grafana, a powerful visualization tool that can display metrics data from a variety of sources.