Mocking is an essential part of unit testing, and the Mockito library makes it easy to write clean and intuitive unit tests for your Java code.
Get started with mocking and improve your application tests using our Mockito guide:
Handling concurrency in an application can be a tricky process with many potential pitfalls. A solid grasp of the fundamentals will go a long way to help minimize these issues.
Get started with understanding multi-threaded applications with our Java Concurrency guide:
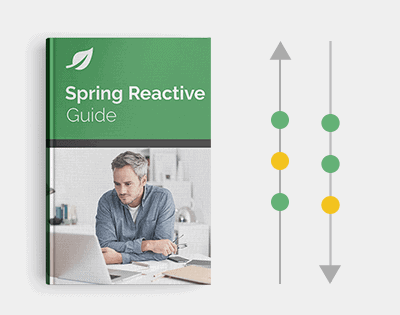
Spring 5 added support for reactive programming with the Spring WebFlux module, which has been improved upon ever since. Get started with the Reactor project basics and reactive programming in Spring Boot:
Since its introduction in Java 8, the Stream API has become a staple of Java development. The basic operations like iterating, filtering, mapping sequences of elements are deceptively simple to use.
But these can also be overused and fall into some common pitfalls.
To get a better understanding on how Streams work and how to combine them with other language features, check out our guide to Java Streams:
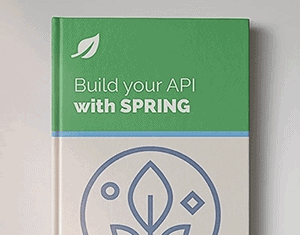
Explore Spring Boot 3 and Spring 6 in-depth through building a full REST API with the framework:
Yes, Spring Security can be complex, from the more advanced functionality within the Core to the deep OAuth support in the framework.
I built the security material as two full courses - Core and OAuth, to get practical with these more complex scenarios. We explore when and how to use each feature and code through it on the backing project.
You can explore the course here:
Spring Data JPA is a great way to handle the complexity of JPA with the powerful simplicity of Spring Boot.
Get started with Spring Data JPA through the guided reference course:
Refactor Java code safely — and automatically — with OpenRewrite.
Refactoring big codebases by hand is slow, risky, and easy to put off. That’s where OpenRewrite comes in. The open-source framework for large-scale, automated code transformations helps teams modernize safely and consistently.
Each month, the creators and maintainers of OpenRewrite at Moderne run live, hands-on training sessions — one for newcomers and one for experienced users. You’ll see how recipes work, how to apply them across projects, and how to modernize code with confidence.
Join the next session, bring your questions, and learn how to automate the kind of work that usually eats your sprint time.
Distributed systems often come with complex challenges such as service-to-service communication, state management, asynchronous messaging, security, and more.
Dapr (Distributed Application Runtime) provides a set of APIs and building blocks to address these challenges, abstracting away infrastructure so we can focus on business logic.
In this tutorial, we'll focus on Dapr's pub/sub API for message brokering. Using its Spring Boot integration, we'll simplify the creation of a loosely coupled, portable, and easily testable pub/sub messaging system:
1. Overview
In Java applications, memory leaks can lead to severe performance degradation and system failures. Developers must understand how memory leaks occur and how to identify and resolve them.
In this tutorial, we’ll provide a guide on creating a memory leak in Java using a lapsed listener problem as an example. We’ll also discuss various methods to detect memory leaks, including logging, profiling, verbose garbage collection, and heap dumps.
2. Create a Memory Leak
We’ll consider a lapsed listener problem as an example of a memory leak. This is an excellent way to learn about memory allocation in Java and garbage collection.
Let’s create an application to send a random movie quote to the users who logged in and subscribed to our service. This application is straightforward and can serve only one user at a time:
public static void main(String[] args) {
    while (true) {
        User user = generateUser();
        logger.debug("{} logged in", user.getName());
        user.subscribe(movieQuoteService);
        userUsingService();
        logger.debug("{} logged out", user.getName());
    }
}
UserGenerator is a simple class providing an unlimited supply of random users. We’ll be using Datafaker for randomization:
public class UserGenerator {

    private final static Faker faker = new Faker();

    public static User generateUser() {
        System.out.println("Generating user");
        String name = faker.name().fullName();
        String email = faker.internet().emailAddress();
        String phone = faker.phoneNumber().cellPhone();
        String street = faker.address().streetAddress();
        String city = faker.address().city();
        String state = faker.address().state();
        String zipCode = faker.address().zipCode();
        return new User(name, email, phone, street, city, state, zipCode);
    }
}
The relationships between users and our service will be based on the Observer pattern. Thus, Users can subscribe to the service, and our MovieQuoteService will update users with a new movie quote.
The main issue with this example is that Users never unsubscribe from the service. This creates a memory leak, as even if the users go out of scope, they cannot be removed by the garbage collector because the service holds their references.
We can explicitly unsubscribe the users to mitigate this problem, which will work. However, the best solution is to use WeakReferences to automate this process.
3. Detecting a Memory Leak
In the previous section, we created an application that has a significant issue – a memory leak. Although this problem can be disastrous, often, it’s hard to detect. Let’s review some of the ways we can find this problem.
3.1. Logging
Let’s start with the most straightforward approach and use logging to find problems with our system. This isn’t the most advanced way to detect memory leaks, but it’s easy to use and might help find anomalies.
While running our service, the log output would show us the user activity:
21:58:24.280 [pool-1-thread-1] DEBUG c.b.lapsedlistener.MovieQuoteService - New quote: Go ahead, make my day.
21:58:24.358 [main] DEBUG c.b.l.LapsedListenerRunner - Earl Runolfsdottir logged in
21:58:24.358 [main] DEBUG c.b.lapsedlistener.MovieQuoteService - Current number of subscribed users: 0
21:58:24.371 [main] DEBUG c.b.l.LapsedListenerRunner - Earl Runolfsdottir logged out
21:58:24.372 [main] DEBUG c.b.l.LapsedListenerRunner - Barbra Rosenbaum logged in
21:58:24.372 [main] DEBUG c.b.lapsedlistener.MovieQuoteService - Current number of subscribed users: 1
21:58:24.383 [main] DEBUG c.b.l.LapsedListenerRunner - Barbra Rosenbaum logged out
21:58:24.383 [main] DEBUG c.b.l.LapsedListenerRunner - Leighann McCullough logged in
21:58:24.383 [main] DEBUG c.b.lapsedlistener.MovieQuoteService - Current number of subscribed users: 2
21:58:24.396 [main] DEBUG c.b.l.LapsedListenerRunner - Leighann McCullough logged out
21:58:24.397 [main] DEBUG c.b.l.LapsedListenerRunner - Mr. Charlie Keeling logged in
21:58:24.397 [main] DEBUG c.b.lapsedlistener.MovieQuoteService - Current number of subscribed users: 3
21:58:24.409 [main] DEBUG c.b.l.LapsedListenerRunner - Mr. Charlie Keeling logged out
21:58:24.410 [main] DEBUG c.b.l.LapsedListenerRunner - Alvin O'Connell logged in
21:58:24.410 [main] DEBUG c.b.lapsedlistener.MovieQuoteService - Current number of subscribed users: 4
21:58:24.423 [main] DEBUG c.b.l.LapsedListenerRunner - Alvin O'Connell logged out
21:58:24.423 [main] DEBUG c.b.l.LapsedListenerRunner - Tracey Stoltenberg logged in
21:58:24.423 [main] DEBUG c.b.lapsedlistener.MovieQuoteService - Current number of subscribed users: 5
We can notice an interesting thing in the previous snippet. As mentioned, our application can handle only one user at a time.
Thus, it’s possible only for one user to subscribe to our service. At the same time, the logs display that the number of subscribers passed this value. Further reading provides even more proof that our system has a problem.
Although logs don’t show where the issue occurred, this is the first step to preventing our system from problems.
3.2. Profiling
This step, like the previous one, aimed to find anomalies in the working application. However, profilers can dramatically simplify monitoring the memory footprint on a working application.
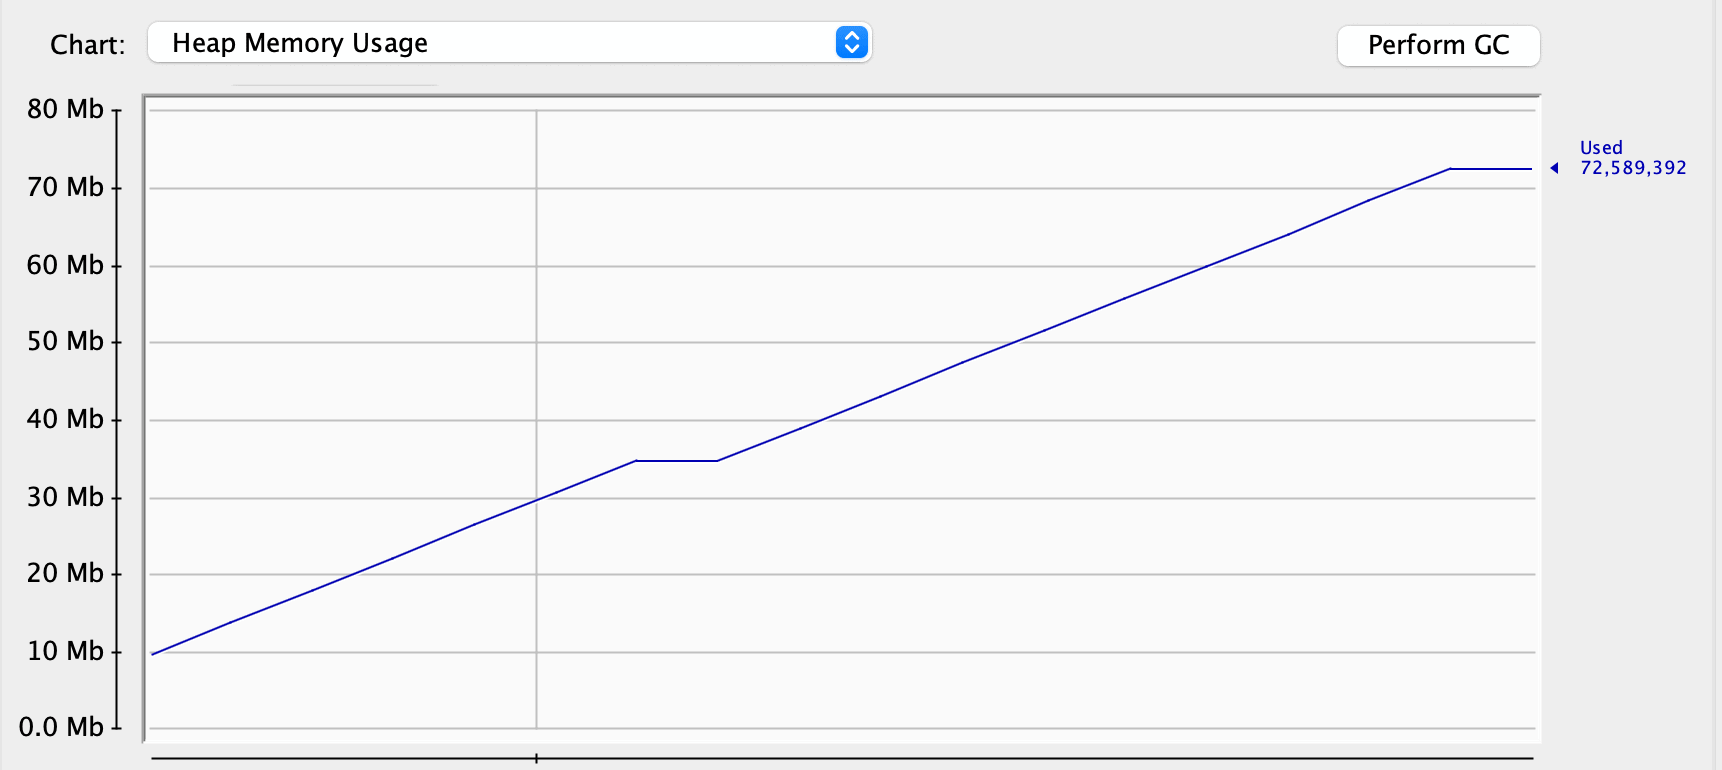
The first giveaway is that the used memory monotonically increases over time. This isn’t always a sign of a memory leak. However, on an application like ours, increasing memory usage might be a good sign that we have a problem.
We’ll be using the JConsole profiler. This is a basic profiler, but it provides all the needed functionality and is included in every JDK distribution. Also, it’s easy to fire it up on any system:
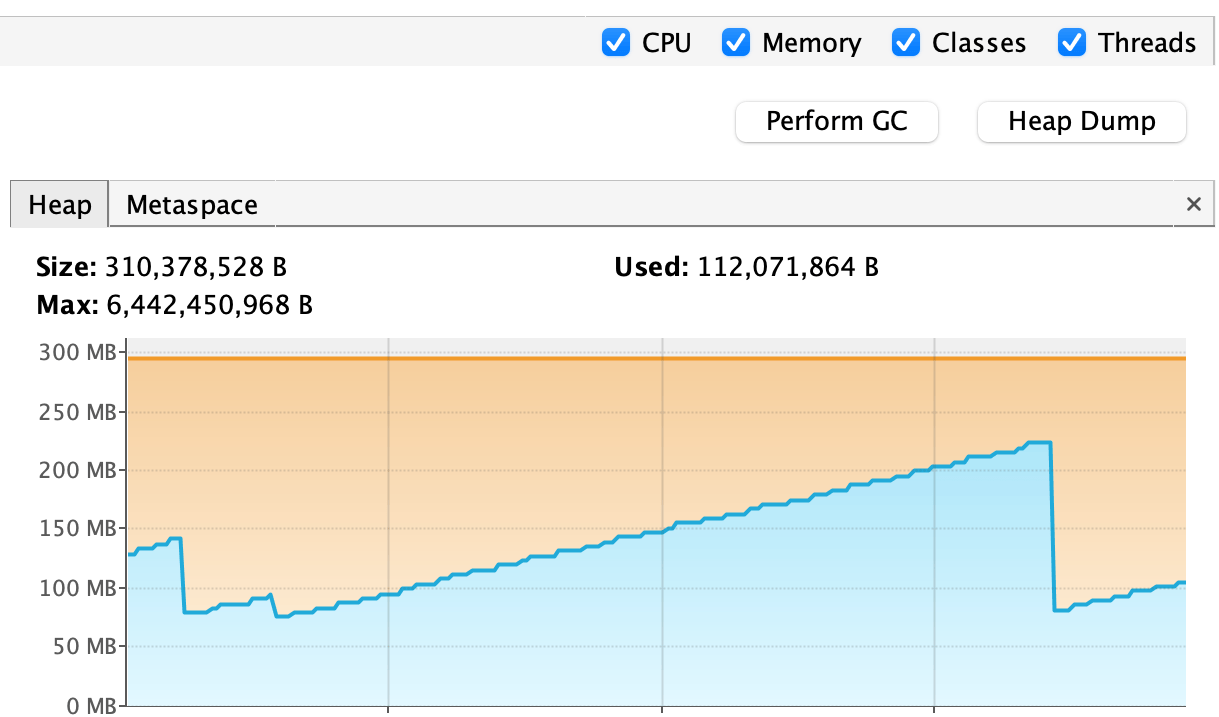
$ jconsoleLet’s start our application and see what JConsole will tell us. After starting the application, its memory consumption increased:
However, memory usage isn’t always the sign of a memory leak. Let’s try to hint the garbage collector to clean up some dead objects:
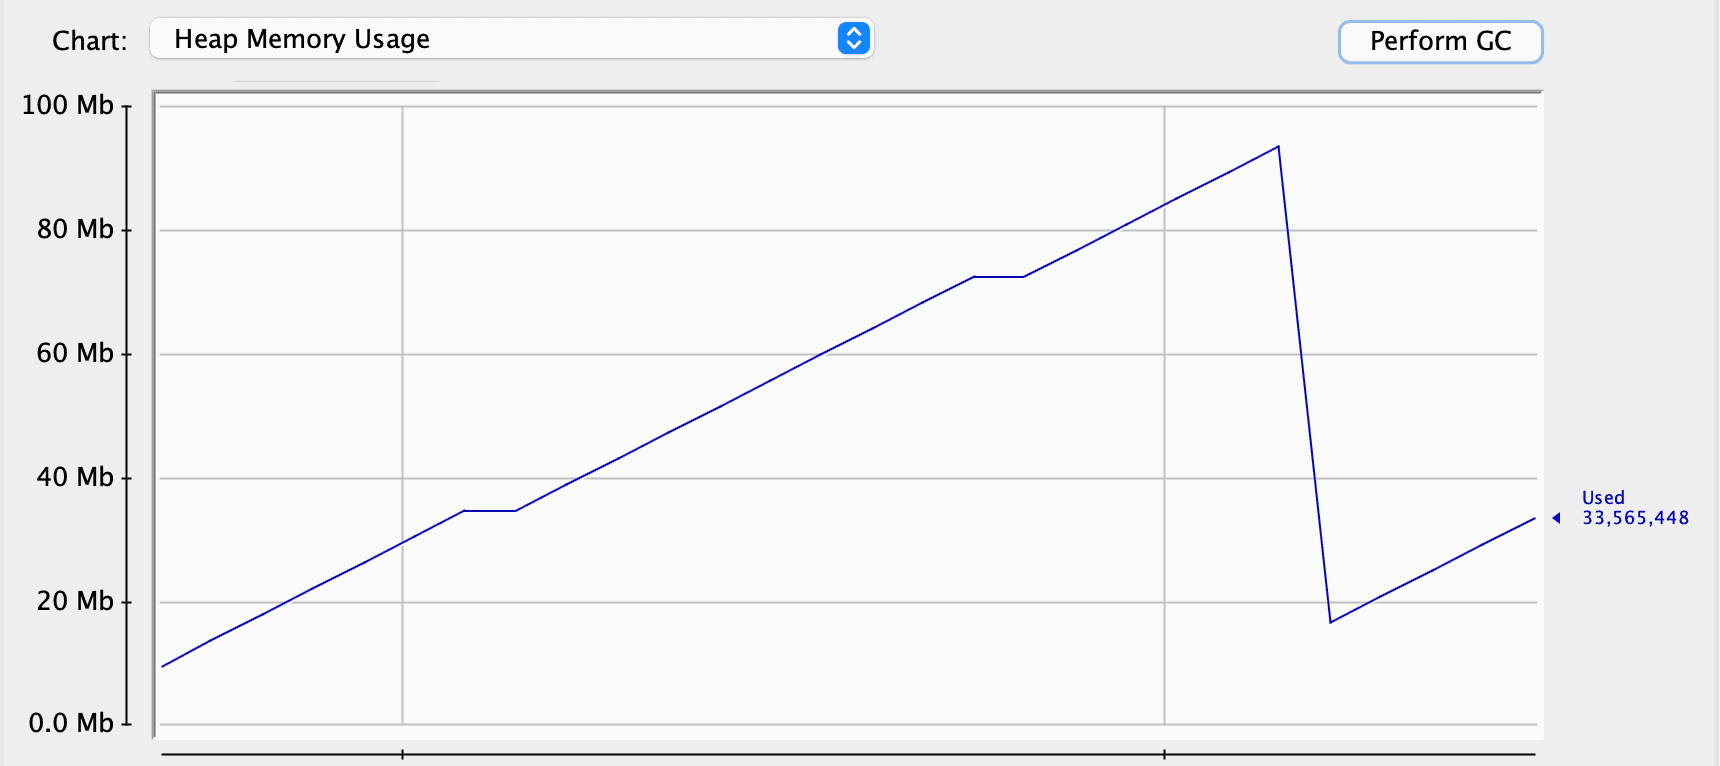
As we can see, the garbage collector worked quite well and cleaned up some space. Thus, we can assume that we don’t have any problems at all. However, let’s look at the Old Generation. This is the space for objects that survived several garbage collections in our application for some time. We can see that it constantly increases in its size:
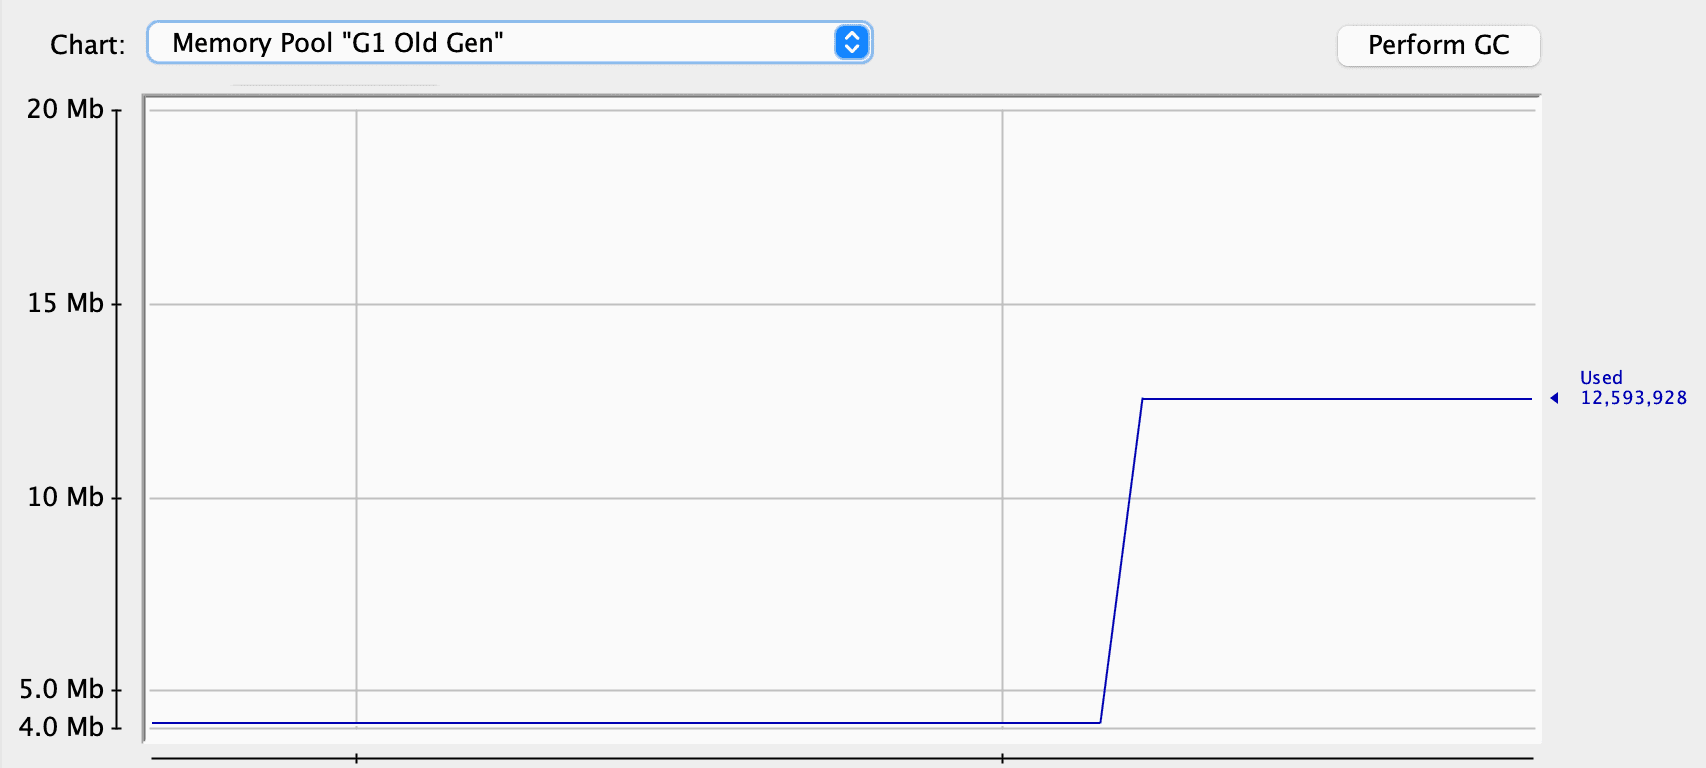
One explanation is that, except for the users, we have quotes. We don’t store the references to the quotes in our application, so the garbage collector has no problems cleaning them up. At the same time, our service keeps the references to every user, preventing them from being garbage collected, and they’re promoted to the Old Generation:
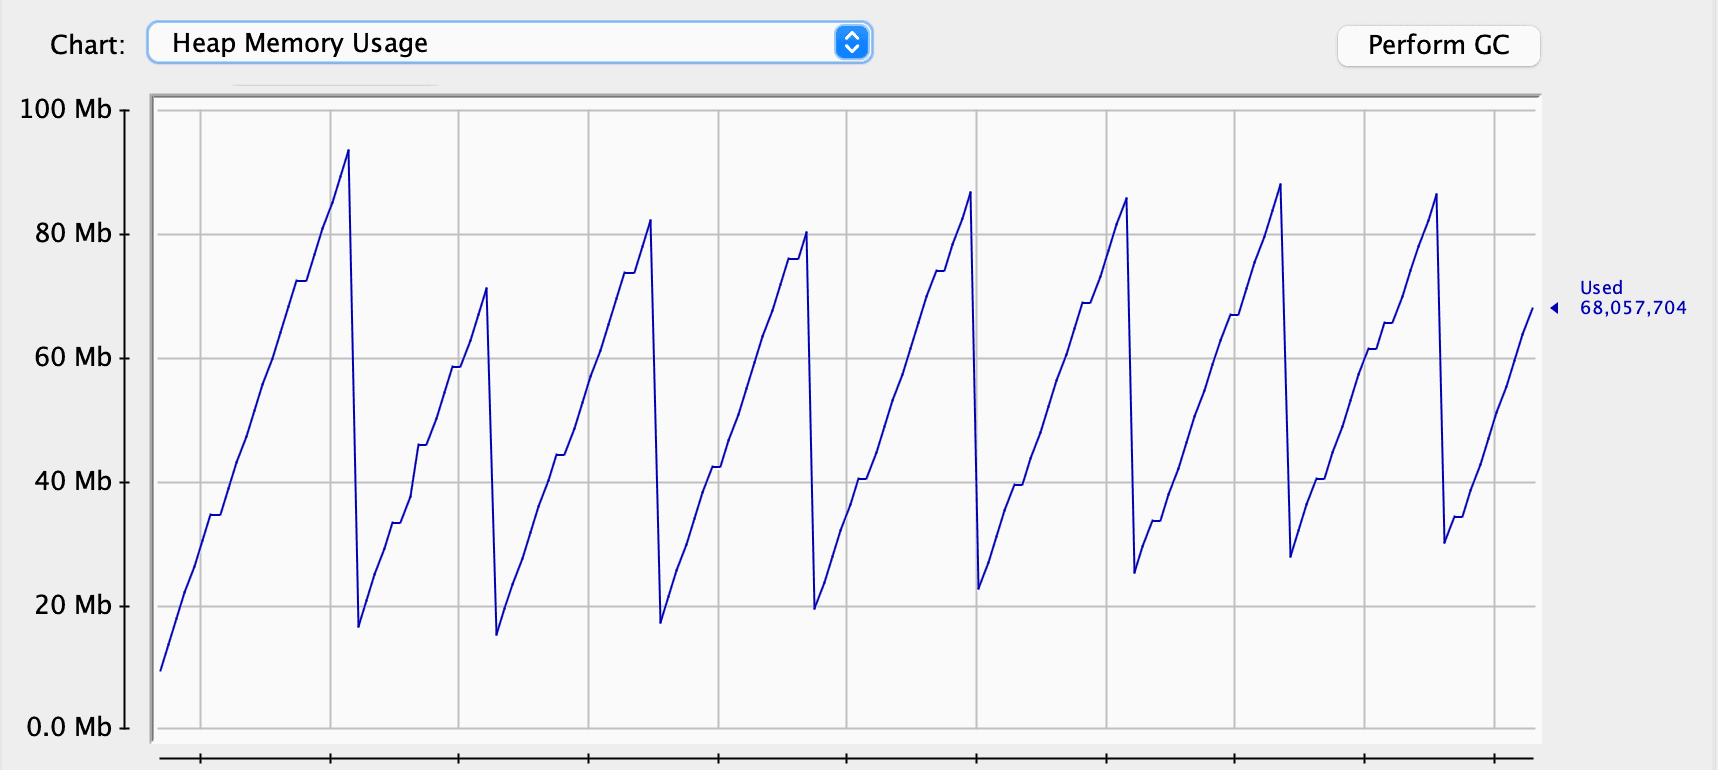
Although the garbage collector cleans regularly, it’s clear that overall memory consumption grows over time. We’ve gone from around 10 MB to 30 MB in a couple of minutes. This might not cause any problem on a server for hours or even days. If the server restarts regularly, we might never see the OutOfMemoryError:

We also have the same picture in the old generation: memory consumption only grows. For our application, which can serve only one user at a time, this is a sign of a problem.
3.3. Verbose Garbage Collection
This is another way to check the state of the heap and the garbage collection process. Depending on the Java version, we can use a couple of flags to switch on verbose garbage collection. The output on the logs will mirror the previous information we got in the JConsole:
[0.004s][info][gc] Using G1
[0.210s][info][gc] GC(0) Pause Young (Normal) (G1 Evacuation Pause) 23M->6M(392M) 1.693ms
[33.169s][info][gc] GC(1) Pause Young (Normal) (G1 Evacuation Pause) 38M->7M(392M) 1.994ms
[250.890s][info][gc] GC(2) Pause Young (Normal) (G1 Evacuation Pause) 203M->16M(392M) 11.420ms
[507.259s][info][gc] GC(3) Pause Young (Normal) (G1 Evacuation Pause) 228M->25M(392M) 14.321ms
[786.181s][info][gc] GC(4) Pause Young (Normal) (G1 Evacuation Pause) 229M->33M(392M) 17.410ms
[1073.277s][info][gc] GC(5) Pause Young (Normal) (G1 Evacuation Pause) 241M->41M(392M) 11.251ms
[1341.717s][info][gc] GC(6) Pause Young (Normal) (G1 Evacuation Pause) 241M->48M(392M) 17.132ms
These logs use a specific format to reveal that overall memory consumption increases over time. This is quite a quick and straightforward way to check the memory footprint of an application and find the problems.
However, after this step, we need to find the cause of this problem. The task might be trivial in our application with a couple of classes, and we can resolve it by reviewing our code. At the same time, it might be impossible to detect the problem just by looking into the code in a huge application.
3.4. Heap Dumps
There are several ways to capture heap dumps, and JDK includes several console tools. We’ll use VisualVM to capture and read heap dumps:
This is a convenient tool to capture a heap dump and includes all the functionality of the JConsole, making the process trivial.
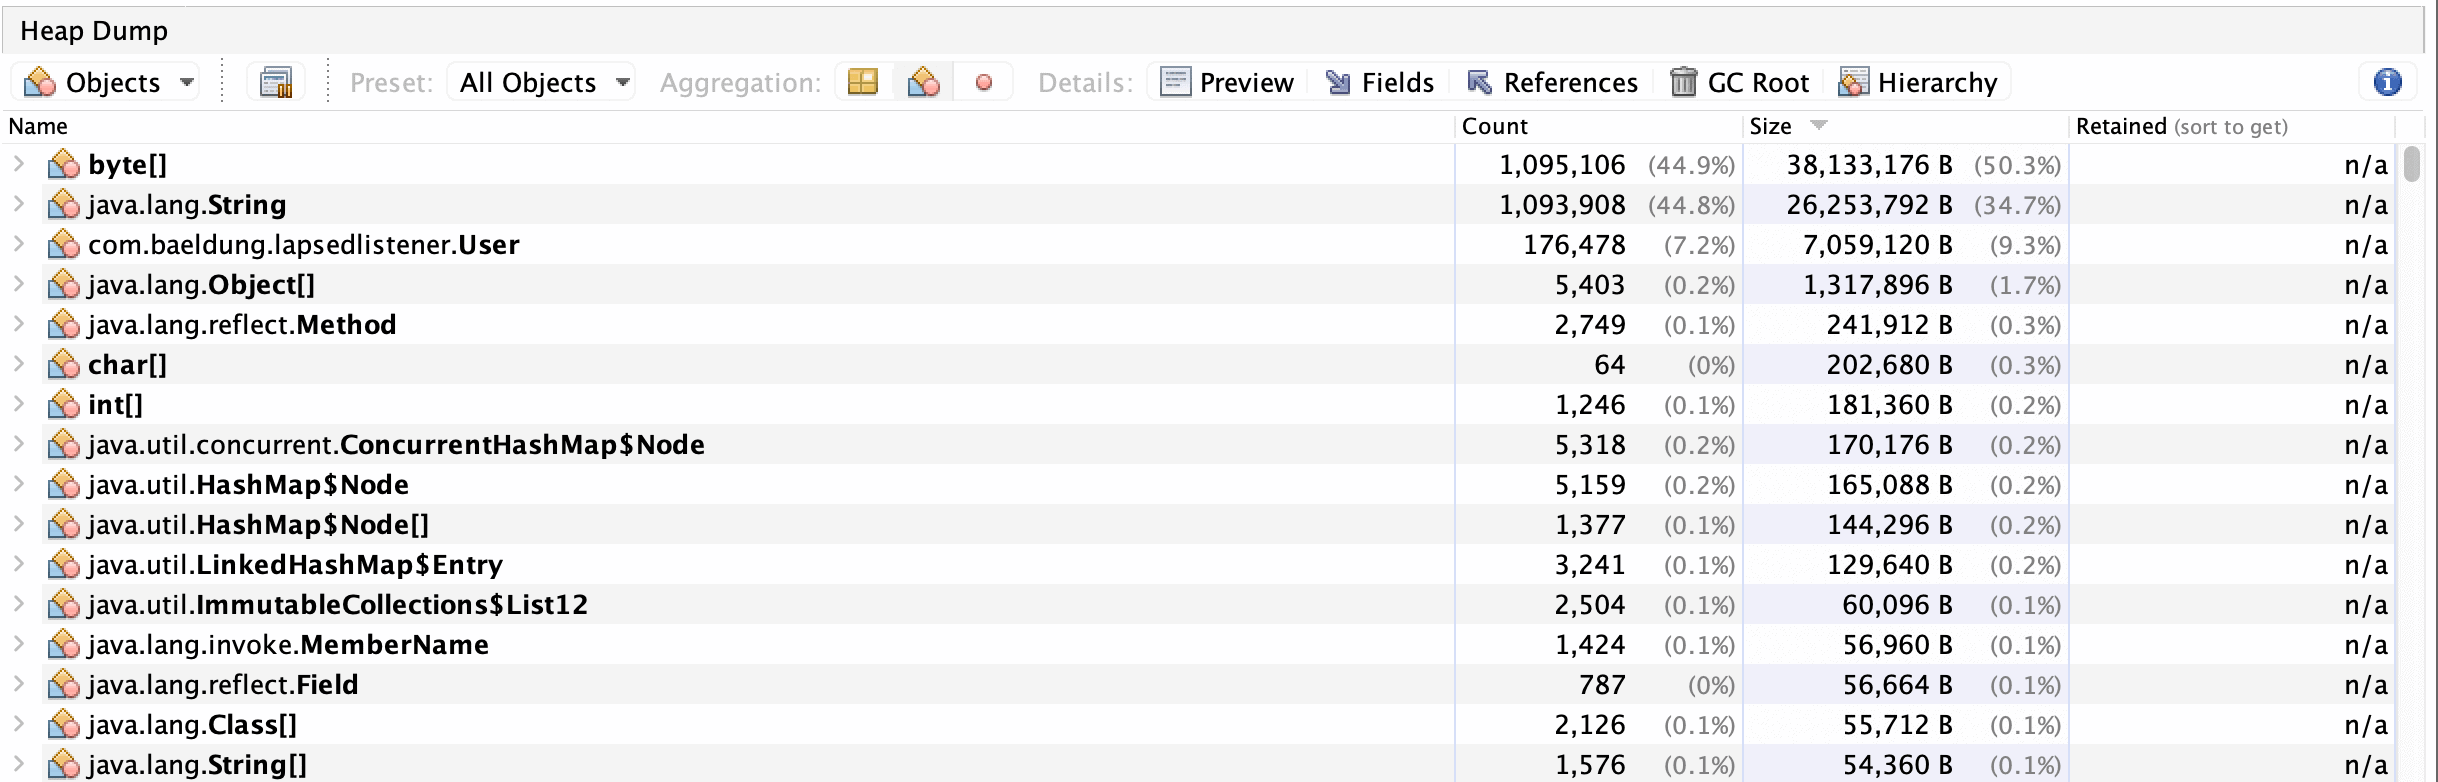
After capturing a heap dump, we can review and analyze it. In our case, we’ll try to find alive objects that should not be there. Luckily for us, VisualVM produces a summary for a heap dump, showing important information:

Users in our system take third place regarding the number of instances and the overall size. We already knew we had a memory consumption problem, and now we found the culprit.
Also, VisualVM allows us to analyze the heap dump more thoroughly and check all the instances in our heap:
This might be helpful in big applications with complex object interaction. Also, this might be useful for tuning the application and finding problematic places.
After finding the problematic instances, we still have to check the code to see when the memory leak appears, but now we can narrow our search.
4. Conclusion
Memory leaks can significantly impact Java applications, leading to gradual memory exhaustion and potential system failures. In this tutorial, we created a memory leak for educational purposes and discussed various detection techniques, including logging, profiling, verbose garbage collection, and heap dumps.
Each method offers valuable insights into an application’s runtime behavior and memory consumption. Logging helps identify anomalies while profiling and verbose garbage collection logs monitor memory usage and garbage collection processes. Heap dumps identify problematic objects and their references, narrowing down the source of the memory leak.