Mocking is an essential part of unit testing, and the Mockito library makes it easy to write clean and intuitive unit tests for your Java code.
Get started with mocking and improve your application tests using our Mockito guide:
Handling concurrency in an application can be a tricky process with many potential pitfalls. A solid grasp of the fundamentals will go a long way to help minimize these issues.
Get started with understanding multi-threaded applications with our Java Concurrency guide:
Spring 5 added support for reactive programming with the Spring WebFlux module, which has been improved upon ever since. Get started with the Reactor project basics and reactive programming in Spring Boot:
Since its introduction in Java 8, the Stream API has become a staple of Java development. The basic operations like iterating, filtering, mapping sequences of elements are deceptively simple to use.
But these can also be overused and fall into some common pitfalls.
To get a better understanding on how Streams work and how to combine them with other language features, check out our guide to Java Streams:
Explore Spring Boot 3 and Spring 6 in-depth through building a full REST API with the framework:
Yes, Spring Security can be complex, from the more advanced functionality within the Core to the deep OAuth support in the framework.
I built the security material as two full courses - Core and OAuth, to get practical with these more complex scenarios. We explore when and how to use each feature and code through it on the backing project.
You can explore the course here:
Spring Data JPA is a great way to handle the complexity of JPA with the powerful simplicity of Spring Boot.
Get started with Spring Data JPA through the guided reference course:
Refactor Java code safely — and automatically — with OpenRewrite.
Refactoring big codebases by hand is slow, risky, and easy to put off. That’s where OpenRewrite comes in. The open-source framework for large-scale, automated code transformations helps teams modernize safely and consistently.
Each month, the creators and maintainers of OpenRewrite at Moderne run live, hands-on training sessions — one for newcomers and one for experienced users. You’ll see how recipes work, how to apply them across projects, and how to modernize code with confidence.
Join the next session, bring your questions, and learn how to automate the kind of work that usually eats your sprint time.
Distributed systems often come with complex challenges such as service-to-service communication, state management, asynchronous messaging, security, and more.
Dapr (Distributed Application Runtime) provides a set of APIs and building blocks to address these challenges, abstracting away infrastructure so we can focus on business logic.
In this tutorial, we'll focus on Dapr's pub/sub API for message brokering. Using its Spring Boot integration, we'll simplify the creation of a loosely coupled, portable, and easily testable pub/sub messaging system:
1. Introduction
In this tutorial, we’ll explore different ways to capture a heap dump in Java.
A heap dump is a snapshot of all the objects that are in memory in the JVM at a certain moment. They are very useful to troubleshoot memory-leak problems and optimize memory usage in Java applications.
Heap dumps are usually stored in binary format hprof files. We can open and analyze these files using tools like jhat or JVisualVM. Also, for Eclipse users, it’s very common to use MAT.
In the next sections, we’ll go through multiple tools and approaches to generate a heap dump, and we’ll show the main differences between them.
2. JDK Tools
The JDK comes with several tools to capture heap dumps in different ways. All these tools are located under the bin folder inside the JDK home directory. Therefore, we can start them from the command line as long as this directory is included in the system path.
In the next sections, we’ll look at how to use these tools to capture heap dumps.
2.1. jmap
jmap is a tool to print statistics about memory in a running JVM. We can use it for local or remote processes.
To capture a heap dump using jmap, we need to use the dump option:
jmap -dump:[live],format=b,file=<file-path> <pid>Along with that option, we should specify several parameters:
- live: if set, it only prints objects which have active references and discards the ones that are ready to be garbage collected. This parameter is optional.
- format=b: specifies that the dump file will be in binary format. If not set, the result is the same.
- file: the file where the dump will be written to
- pid: id of the Java process
An example would look like:
jmap -dump:live,format=b,file=/tmp/dump.hprof 12587Remember that we can easily get the pid of a Java process by using the jps command.
Also, keep in mind that jmap was introduced in the JDK as an experimental tool and is unsupported. Therefore, in some cases, it may be preferable to use other tools instead.
2.2. jcmd
jcmd is a very complete tool that works by sending command requests to the JVM. We have to use it in the same machine where the Java process is running.
One of its many commands is the GC.heap_dump. We can use it to get a heap dump just by specifying the pid of the process and the output file path:
jcmd <pid> GC.heap_dump <file-path>We can execute it with the same parameters that we used before:
jcmd 12587 GC.heap_dump /tmp/dump.hprofAs with jmap, the dump generated is in binary format.
2.3. JVisualVM
JVisualVM is a tool with a graphical user interface that lets us monitor, troubleshoot, and profile Java applications. The GUI is simple, but very intuitive and easy to use.
One of its many options allows us to capture a heap dump. If we right-click on a Java process and select the “Heap Dump” option, the tool will create a heap dump and open it in a new tab:
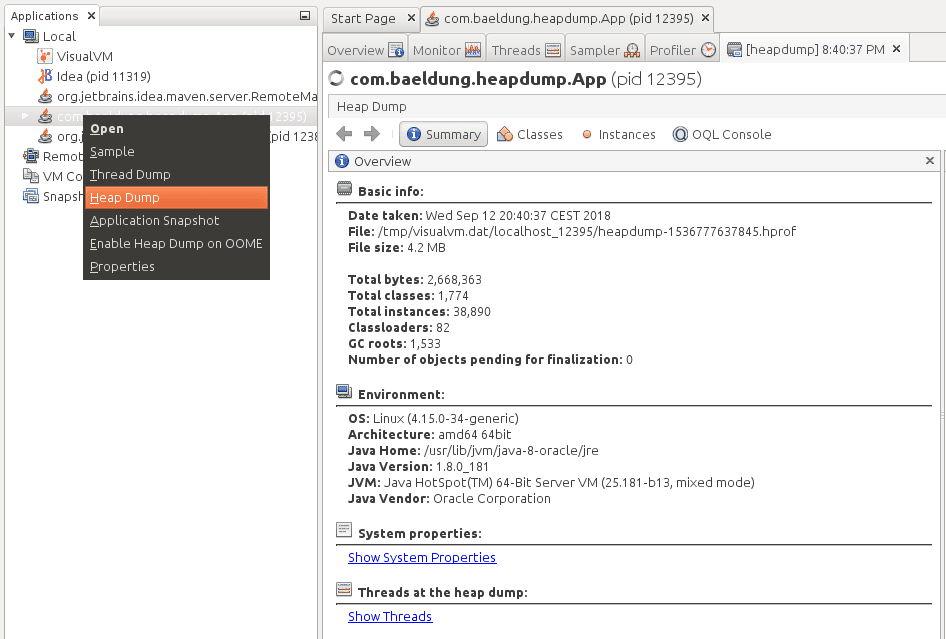
Notice that we can find the path of the file created in the “Basic Info” section.
Starting from JDK 9, Visual VM isn’t included in the Oracle JDK and Open JDK distributions. Therefore, if we’re using anything newer than Java 9, we can get the JVisualVM from the Visual VM open source project site.
3. Capture a Heap Dump Automatically
All the tools we’ve shown in the previous sections are intended to capture heap dumps manually at a specific time. In some cases, we want to get a heap dump when a java.lang.OutOfMemoryError occurs to help us investigate the error.
For these cases, Java provides the HeapDumpOnOutOfMemoryError command-line option, which generates a heap dump when a java.lang.OutOfMemoryError is thrown:
java -XX:+HeapDumpOnOutOfMemoryErrorBy default, it stores the dump in a java_pid<pid>.hprof file in the directory where we’re running the application. If we want to specify another file or directory, we can set it in the HeapDumpPath option:
java -XX:+HeapDumpOnOutOfMemoryError -XX:HeapDumpPath=<file-or-dir-path>When our application runs out of memory using this option, we’ll be able to find the created file that contains the heap dump in the logs:
java.lang.OutOfMemoryError: Requested array size exceeds VM limit
Dumping heap to java_pid12587.hprof ...
Exception in thread "main" Heap dump file created [4744371 bytes in 0.029 secs]
java.lang.OutOfMemoryError: Requested array size exceeds VM limit
	at com.baeldung.heapdump.App.main(App.java:7)
In the above example, it was written to the java_pid12587.hprof file.
As we can see, this option is very useful, and there’s no overhead when running an application with this option. Therefore, it’s highly recommended to always use this option, especially in production.
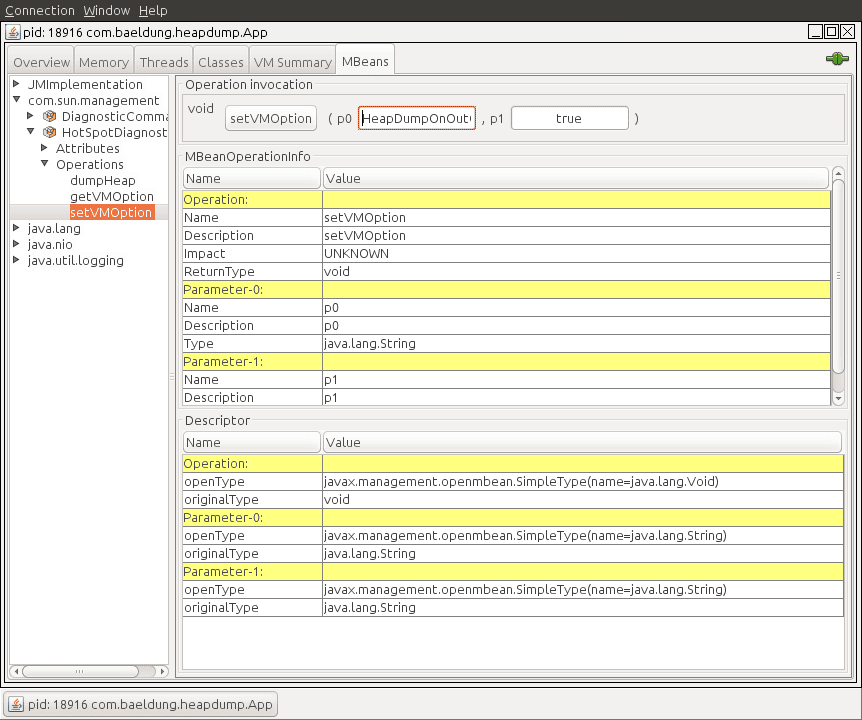
Finally, this option can also be specified at runtime by using the HotSpotDiagnostic MBean. To do this, we can use JConsole and set the HeapDumpOnOutOfMemoryError VM option to true:
We can find more information about MBeans and JMX in this article.
4. JMX
The last approach we’ll cover in this article is using JMX. We’ll use the HotSpotDiagnostic MBean that we briefly introduced in the previous section. This MBean provides a dumpHeap method that accepts two parameters:
- outputFile: the path of the file for the dump. This file should have the hprof extension.
- live: if set to true, it dumps only the active objects in memory, as we saw before with jmap.
In the next sections, we’ll show two different ways to invoke this method in order to capture a heap dump.
4.1. JConsole
The easiest way to use the HotSpotDiagnostic MBean is by using a JMX client, such as JConsole.
If we open JConsole and connect to a running Java process, we can navigate to the MBeans tab and find the HotSpotDiagnostic under com.sun.management. In operations, we can find the dumpHeap method that we previously described:
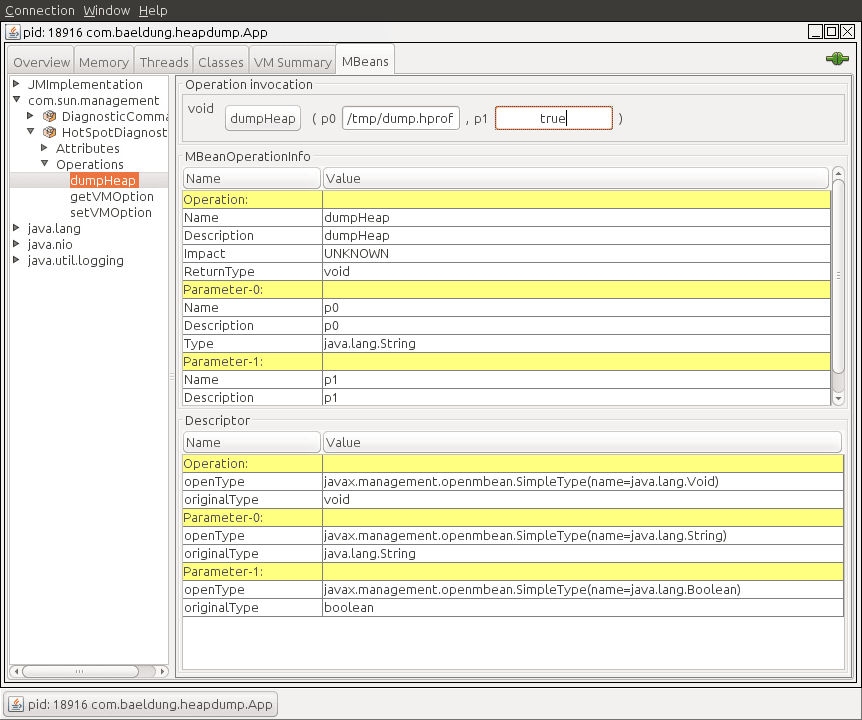
As shown, we just need to introduce the parameters, outputFile and live, into the p0 and p1 text fields in order to perform the dumpHeap operation.
4.2. Programmatic Way
The other way to use the HotSpotDiagnostic MBean is by invoking it programmatically from Java code.
To do this, we first need to get an MBeanServer instance in order to get an MBean that’s registered in the application. After that, we simply need to get an instance of a HotSpotDiagnosticMXBean, and call its dumpHeap method.
Let’s see it in code:
public static void dumpHeap(String filePath, boolean live) throws IOException {
    MBeanServer server = ManagementFactory.getPlatformMBeanServer();
    HotSpotDiagnosticMXBean mxBean = ManagementFactory.newPlatformMXBeanProxy(
      server, "com.sun.management:type=HotSpotDiagnostic", HotSpotDiagnosticMXBean.class);
    mxBean.dumpHeap(filePath, live);
}
Notice that an hprof file cannot be overwritten. Therefore, we should take this into account when creating an application that prints heap dumps. If we fail to do so, we’ll get an exception:
Exception in thread "main" java.io.IOException: File exists
	at sun.management.HotSpotDiagnostic.dumpHeap0(Native Method)
	at sun.management.HotSpotDiagnostic.dumpHeap(HotSpotDiagnostic.java:60)
5. Conclusion
In this article, we learned multiple ways to capture a heap dump in Java.
As a rule of thumb, we should always remember to use the HeapDumpOnOutOfMemoryError option when running Java applications. For different purposes, any of the other tools can be used, as long as we keep in mind the unsupported status of jmap.